How to create a Deck of views in Alphacast?
In Alphacast, a Deck is a way to display charts interactively using filters. Instead of creating multiple similar charts, a Deck allows you to reuse the same visualization and change what is displayed based on user selections.
The core idea is simple: a dataset feeds one or more charts, and users control the view through filters.
Creating a Deck
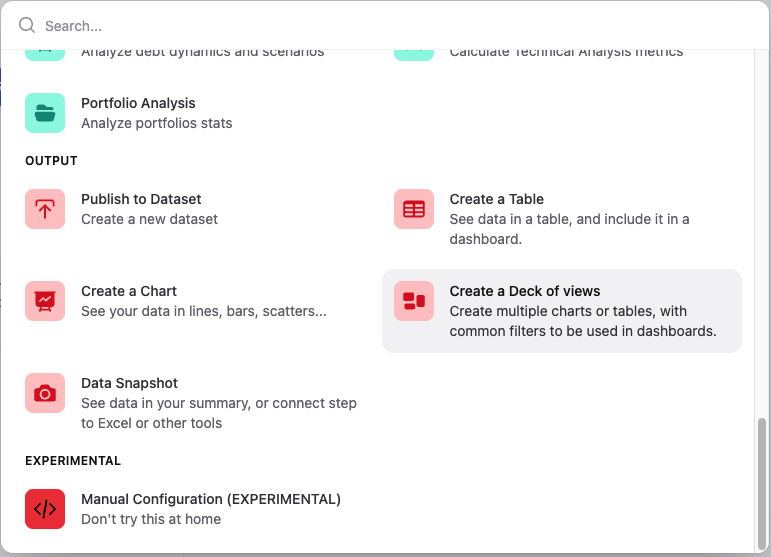
Decks are created from a pipeline that contains the dataset you want to use. Just add the step Create a Deck of views. This step defines a Deck that will contain all the interactive views and filters.
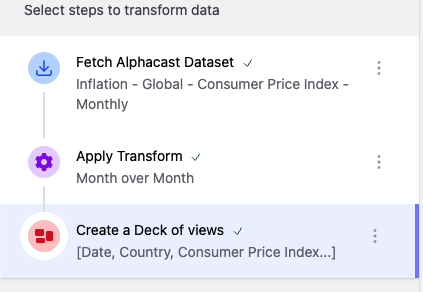
The dataset status before the Create a Deck of views step becomes the data source for the entire Deck. For example, if we want a Deck with MoM % change on inflation for many countries, pipeline should look as below:
Adding views to a Deck
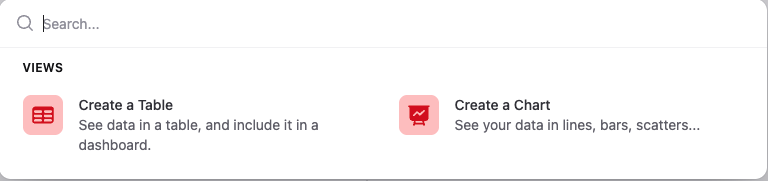
Once the Deck is created, you can add a Chart or a Table view from the Add view button. You can add as many views as you want; each view can be linked to a specific series of the dataset.
After choosing the view type, you can select the series that will be used as input for that view. The entities associated with those series automatically become the filters of the Deck.
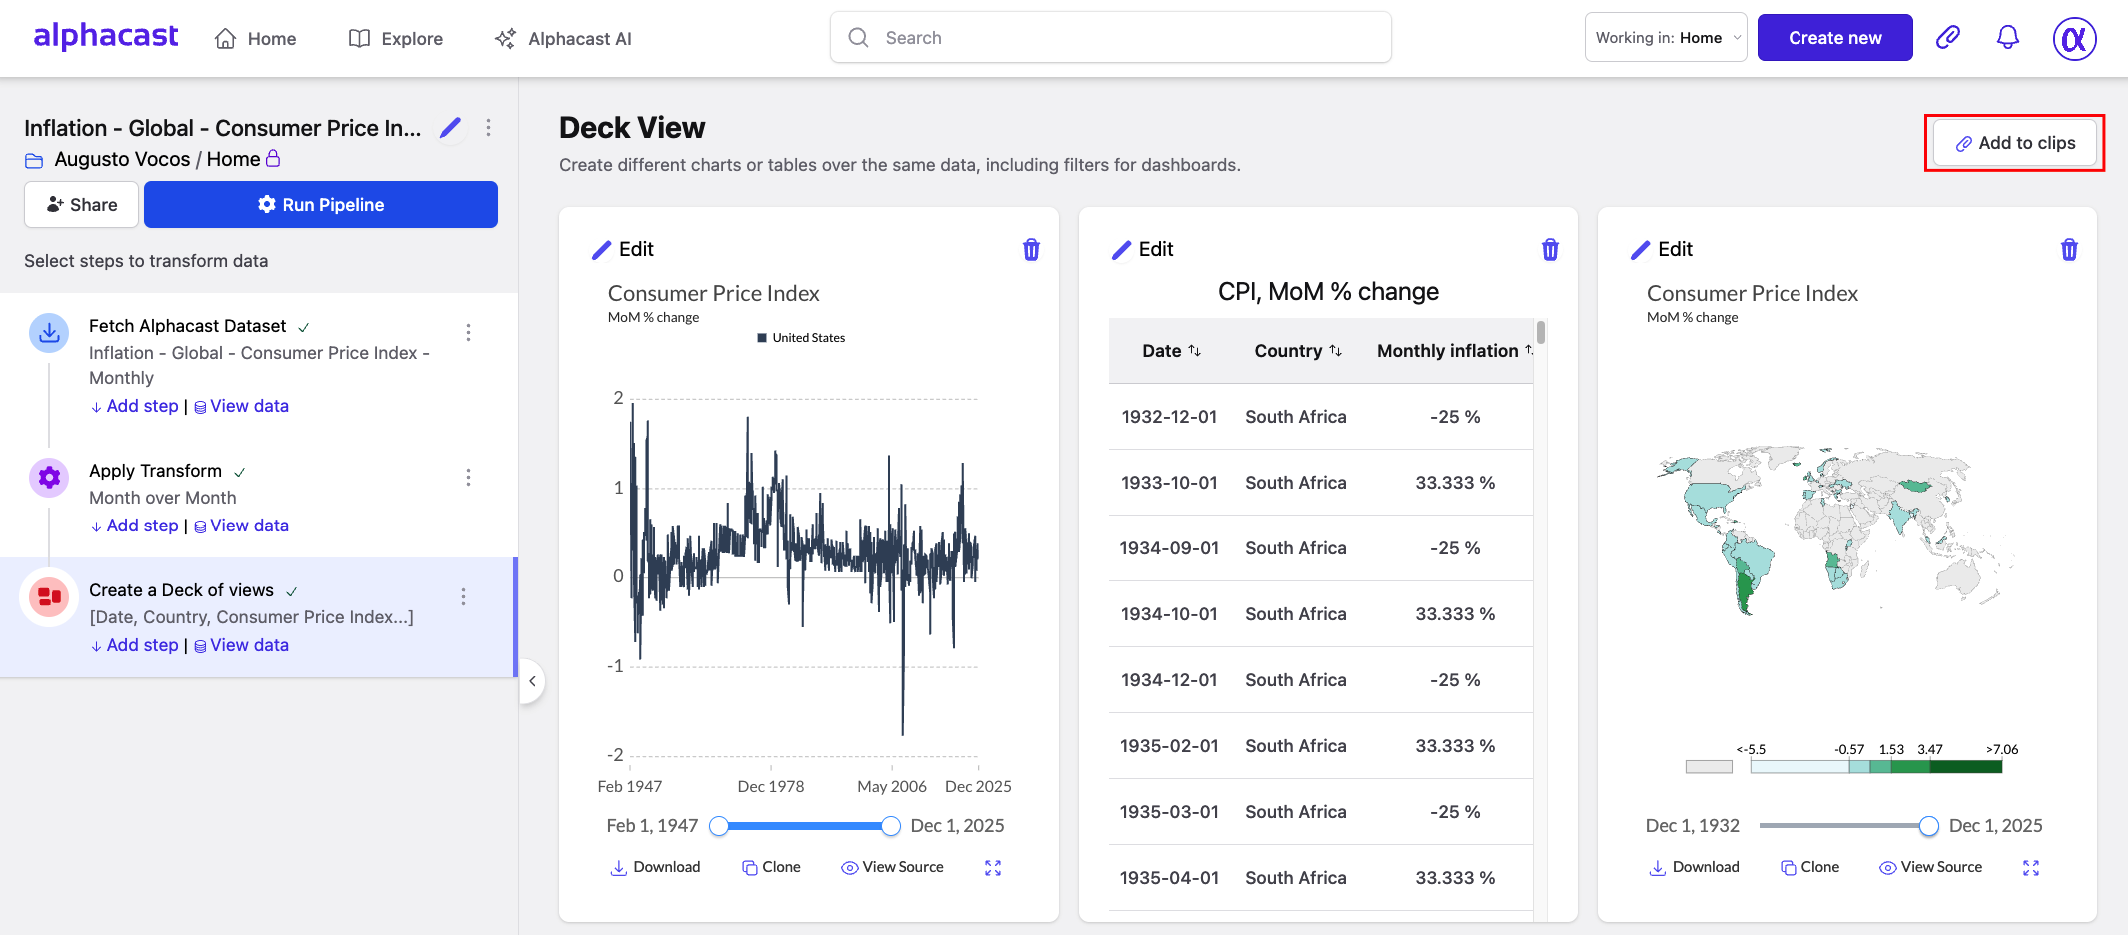
Also, you can edit each view separately, modifying titles, subtitles, units, etc.
Clipping views and creating an Insight
After configuring the views, the final step is to clip the Deck using the button Add to clips on the top right corner. Clipping freezes the current configuration of the view, including the selected filters and layout.
Once clipped, the view can be embedded into a Dashboard. Dashboards allow you to embed the clipped view into reports while preserving its interactive behavior.
In the Edit mode of a Dashboard, go to the Clips button; you will find the clipped Deck under the Decks section. Inside the clipped Deck, you will see separate items for Filters and for the Chart and/or Table.
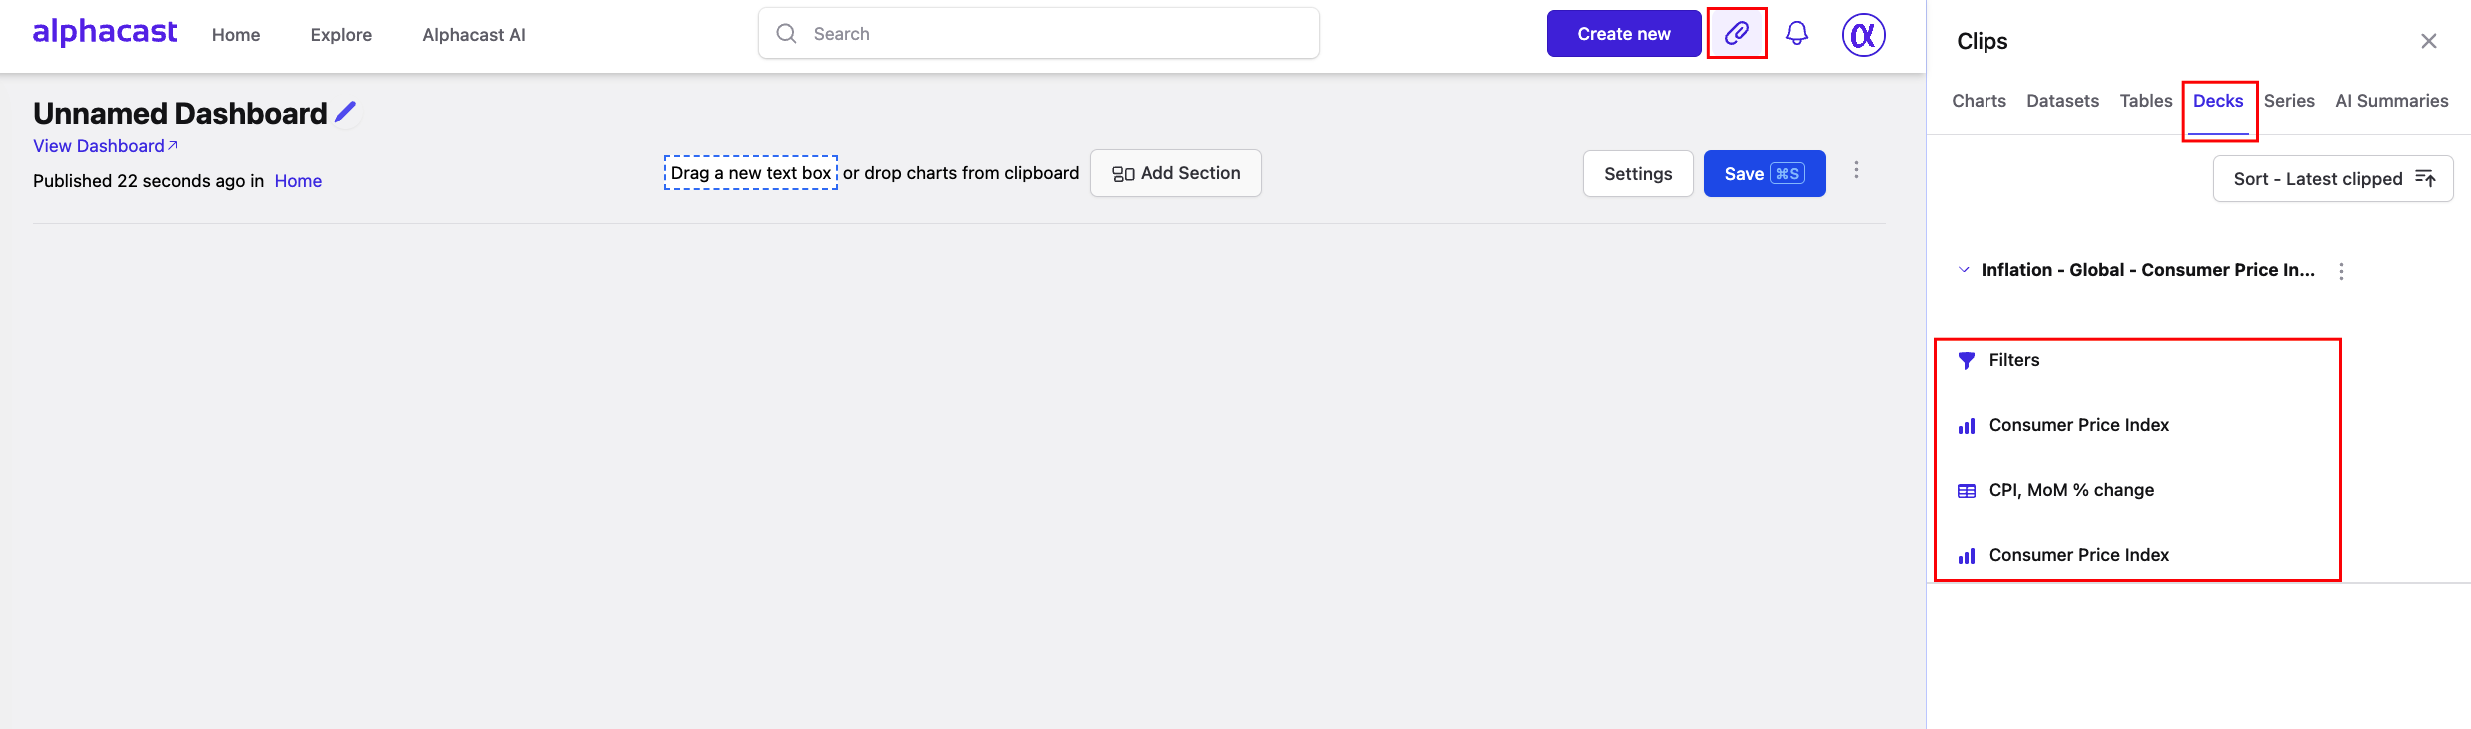
To add them to the Dashboard, simply drag the Filters and the corresponding Chart or Table onto the canvas and arrange them as needed.
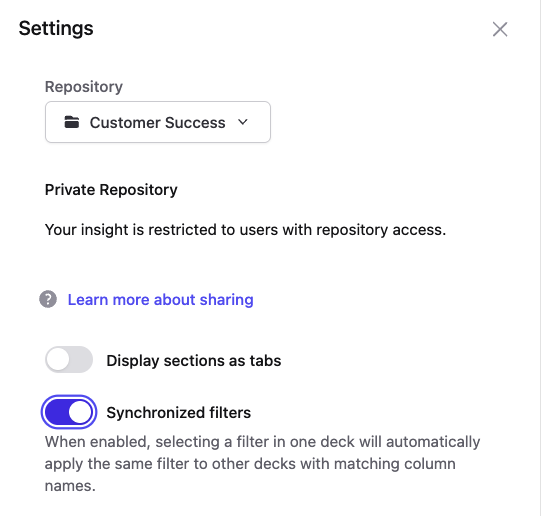
You can edit the Filters section using the pencil icon on it. You can choose which entities will function as filters, as well as the default values for each one of them. If you have two separate decks and both of them have the same entities, you can synchronize both filters into one, allowing you to interact with both decks using the same entities. This can be toggled in the Settings section of the Dashboard.
Once items are set up, just hit Save.
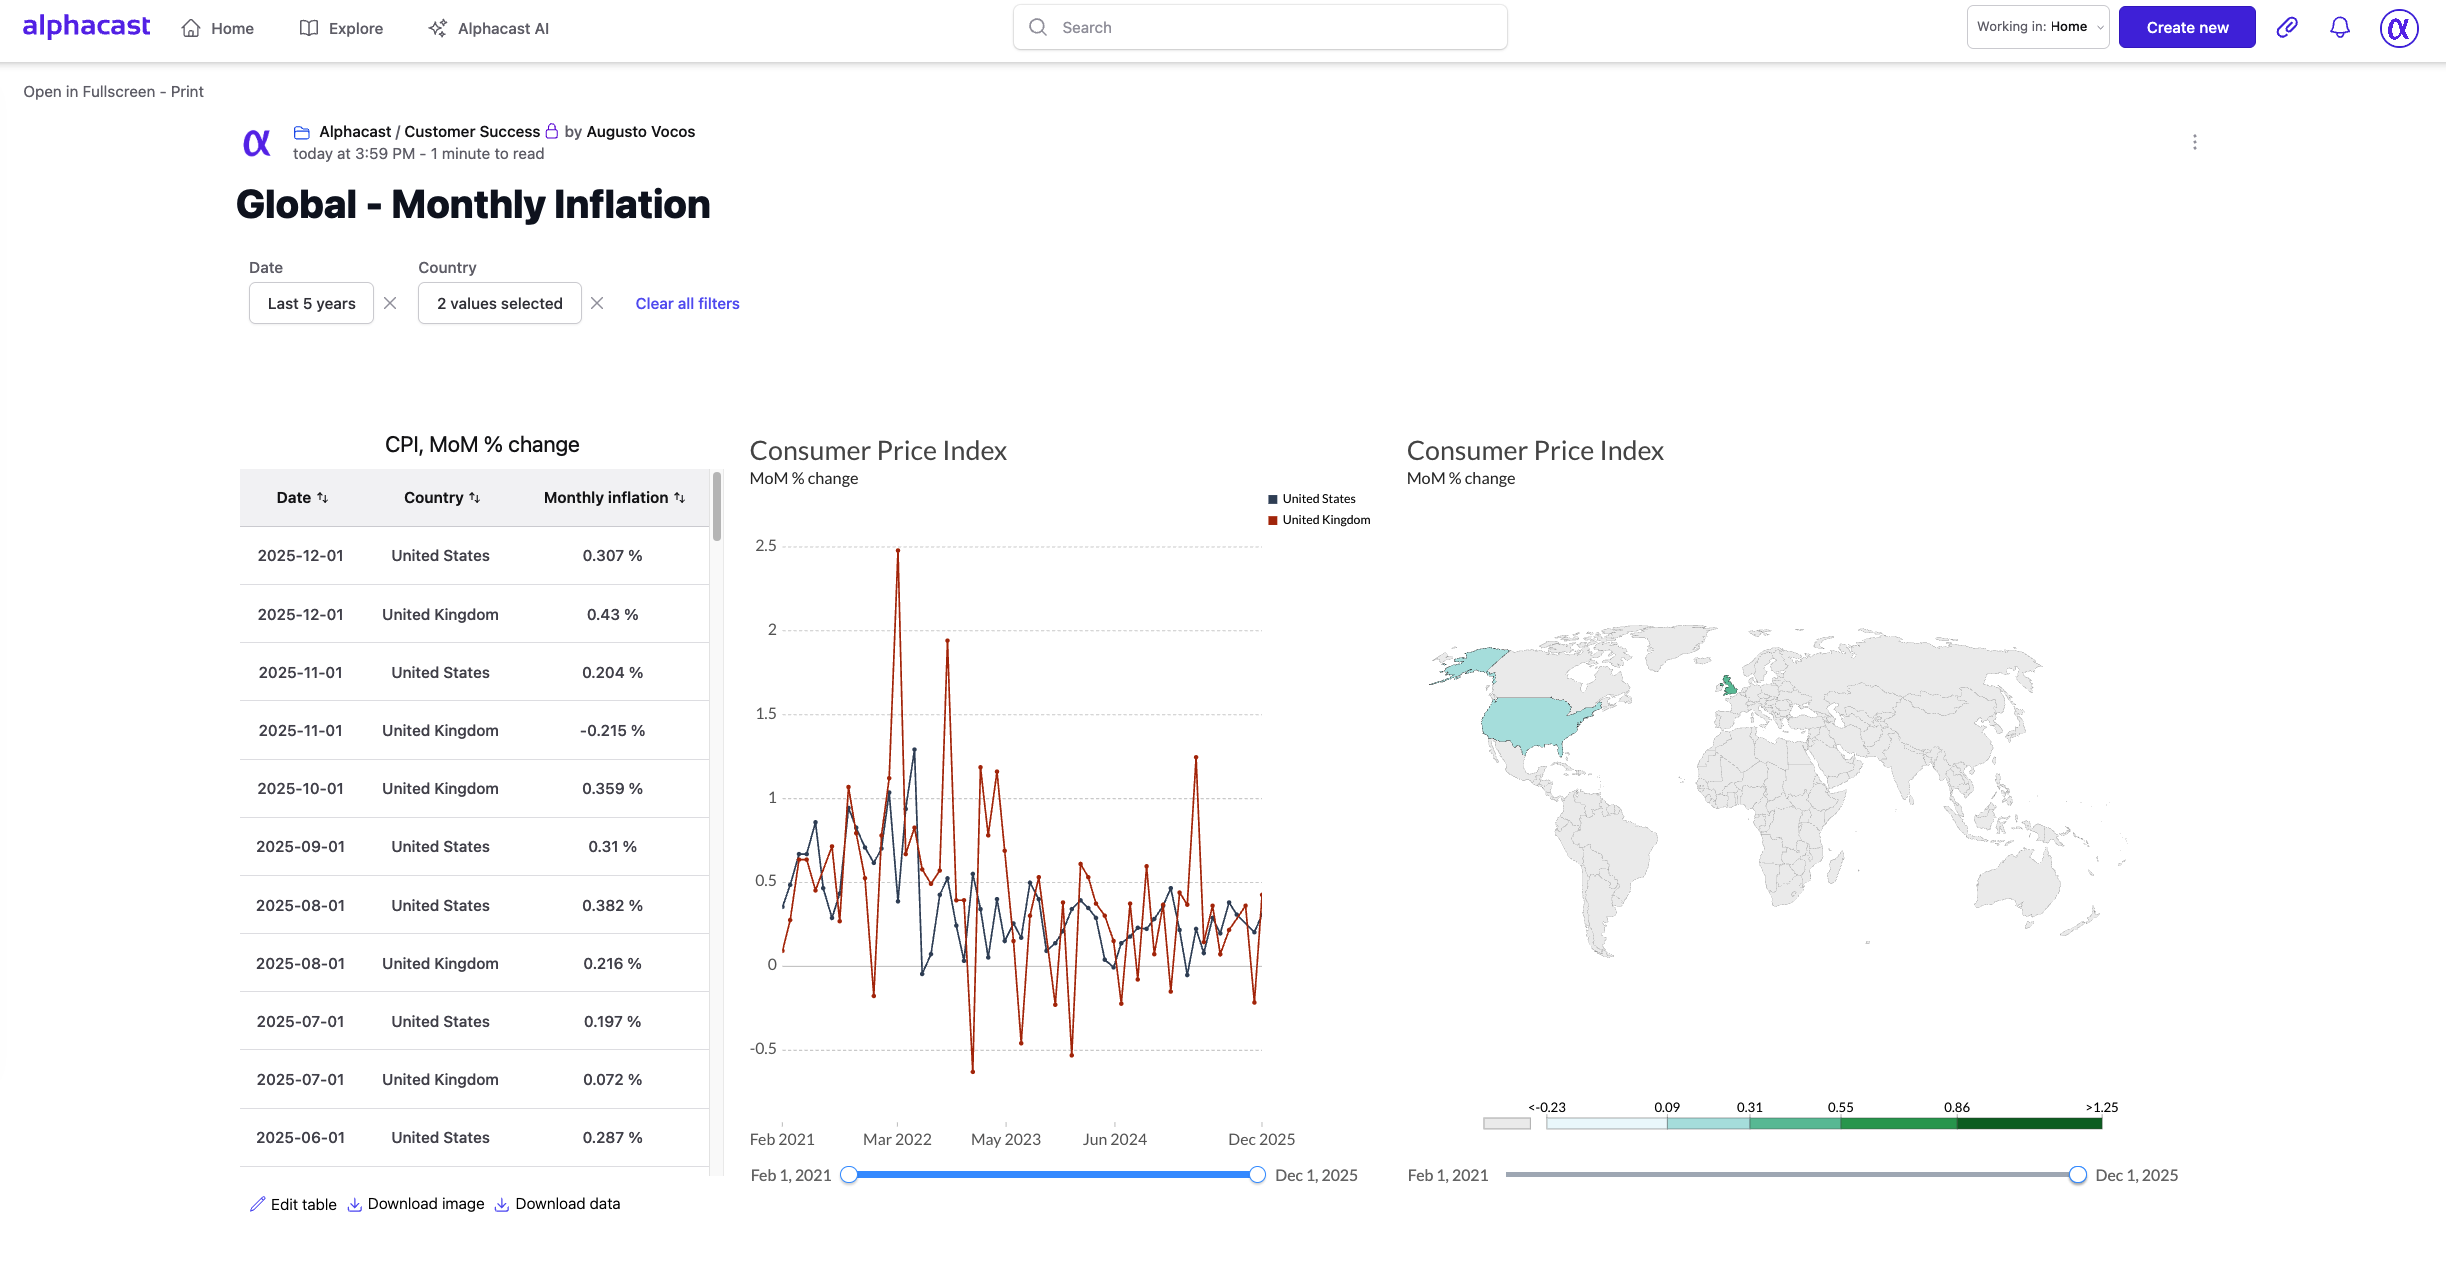
You can access the final result of our example here.
And there you go! You have just created a Deck in Alphacast, a view of charts and tables interactive with a unified filter.